Magnetic fieldlines of the Earth
One of the labours of Hercules was surely to find a map of Earth’s magnetic field.
There’s no shortage of crude diagrams of bar magnets superimposed over cartoon globes, and plentiful plots of isogonic lines to be procured from multiple perspectives; yet for accurate depictions of the simple lines of magnetism over Earth’s surface, the offerings seem sorely slack. So just imagine how hard that would have been two thousand years before the internet.
The most common chart I see that has an actual connection to reality, is a map of isogonic lines – contours of equal magnetic declination. It usually looks exactly like this, with perhaps a minor variation of epoch:
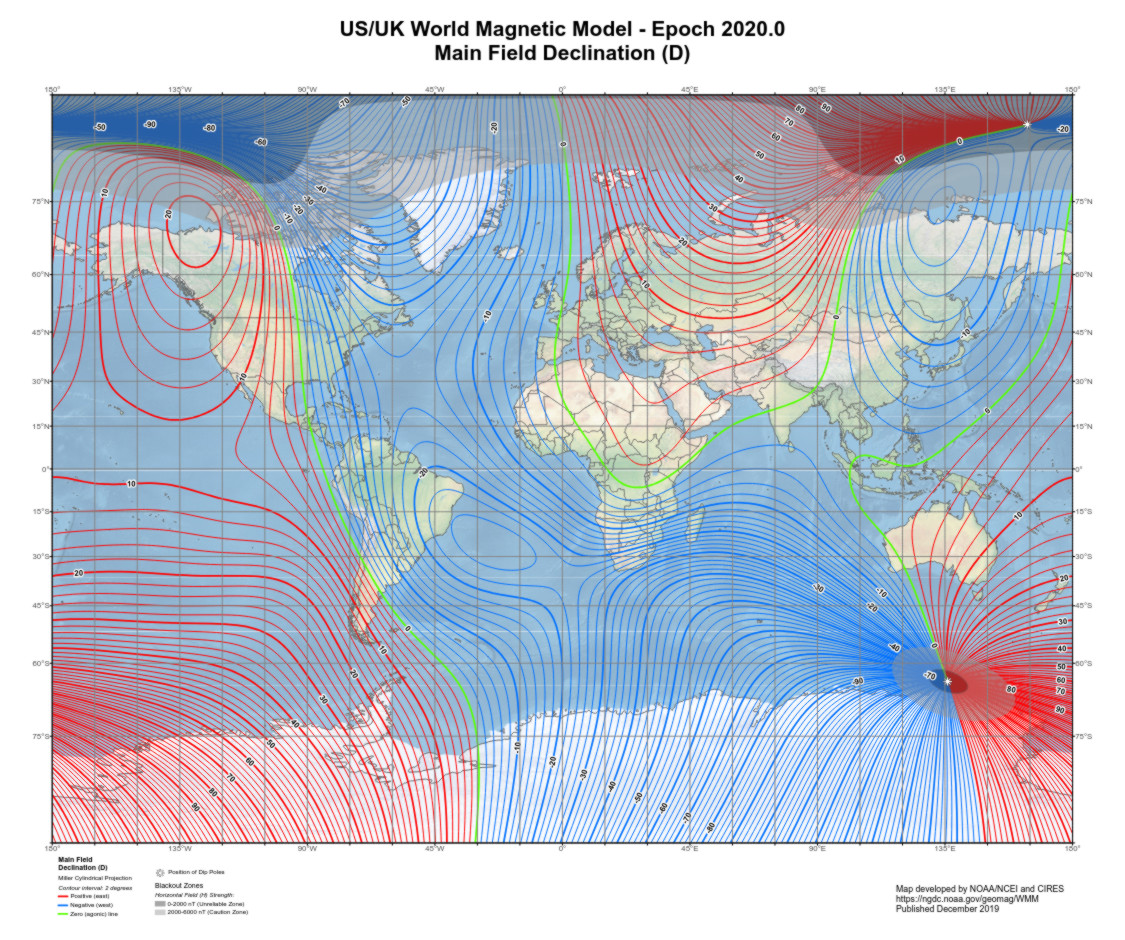
Almost as if websites were all mirroring the exact same plot. Well I never. (You can get your copy here.)
And I get it – if you’re using a compass, you want to know exactly what angle from the needle points north, for the particular part of the planet you’re navigating. 2° contours make it pretty easy to read that, for example, someone in Wellington wants to be looking 23° to the west of their compass bearing.
But it’s no good for getting a feeling for just what our maniacal magnetic field is getting up to. Those bright green ‘0’ curves aren’t magnetic field lines; they show everywhere on Earth where the magnetic field is pointing north. And since the curves do not themselves generally point north, evidently following the local field from one will quickly take you off course in a different direction. But which direction?
Well the short story is I’ve never found much of anything. Maybe the odd mention of ‘magnetic meridians’ at best, alongside a basic diagram of the north and maybe south pole, perhaps even from the present century; but certainly nothing like that ubiquitous Miller map of declinations that could offer a global view of field lines in their entirety and their relation to those nearby.
It’s not even like this is esoteric wisdom – models and calculators of declination are widely available, then all you have to do is add declination values across the world to the true north vectors, and you’ll have the actual compass heading everywhere.
So that’s what I was ultimately compelled to do, just to remedy this unforgiveable absence of seemingly basic information.
The approach is pretty simple – I used Justin Myers’s Python port of the World Magnetic Model to programmatically generate field vectors, then threw those at Cartopy and Matplotlib to calculate fieldlines and project those and continents onto a map. And this all based on Python solely because I’m told that’s what the cool kids are using now, rather than Matlab or Octave or whatever. In fact, it’s as I write this that I check the metadata on that WMM plot and see it was apparently generated with Python too.
Now that you know the enlightening history behind my family Crème brûlée recipe, here are the much awaited maps:
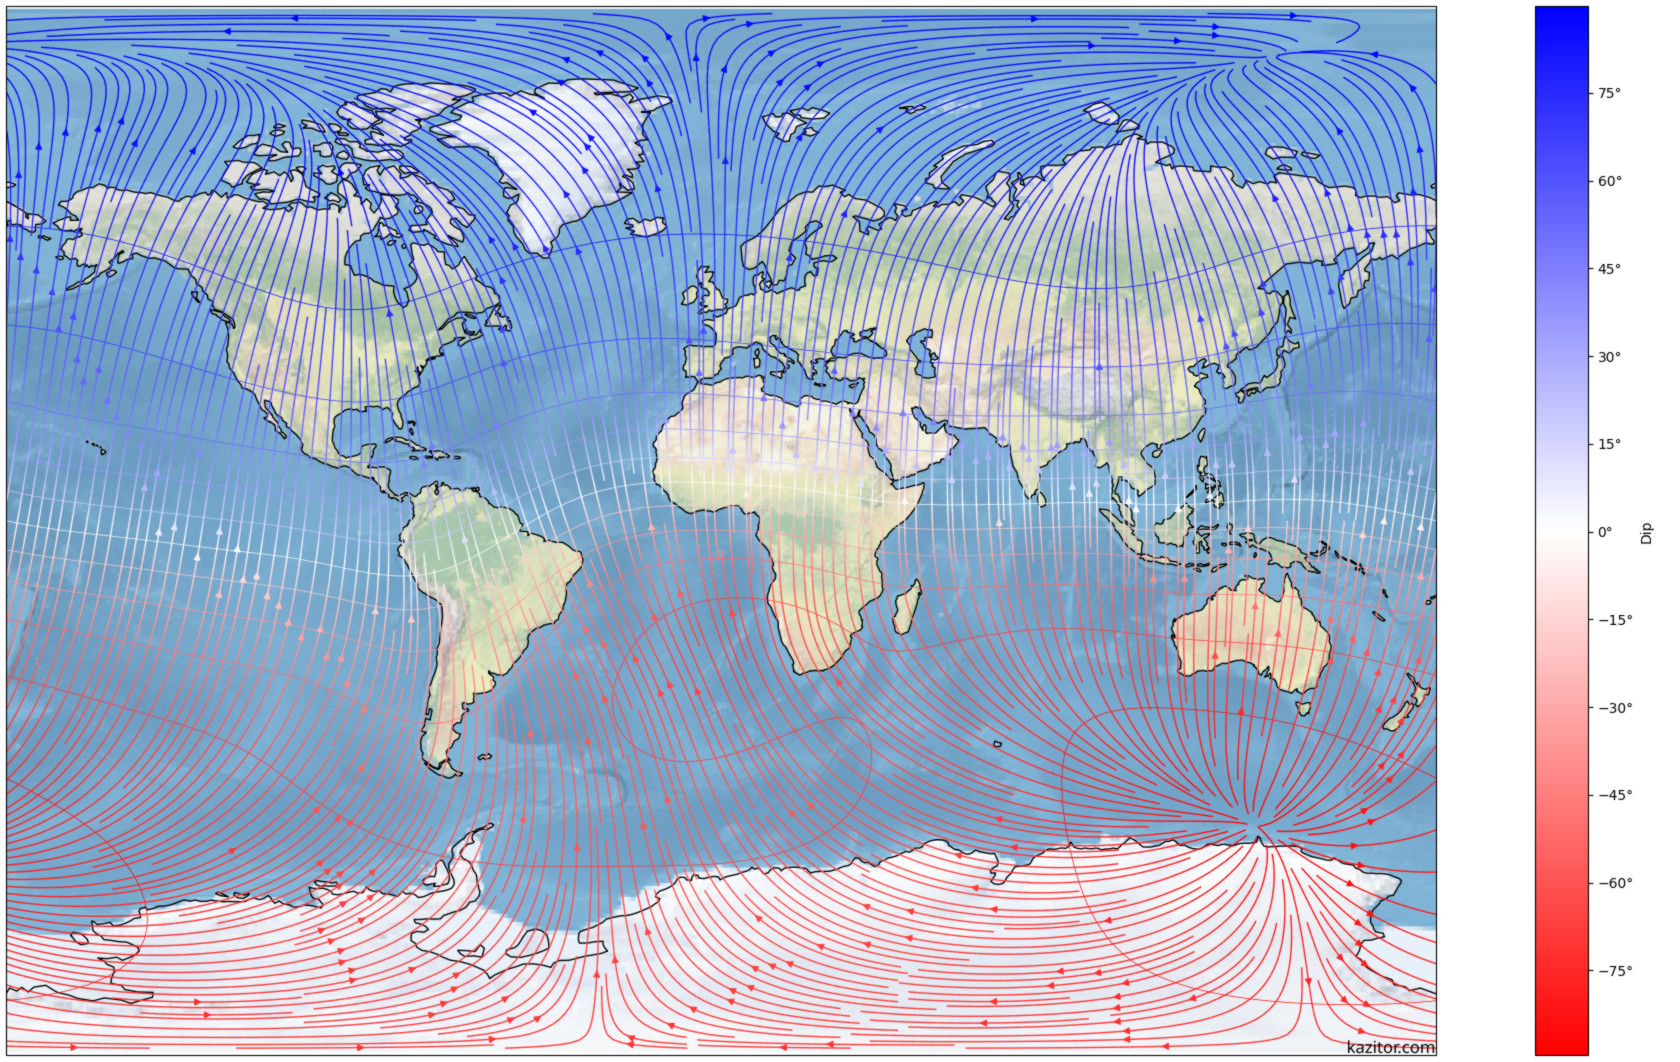
Horizontal magnetic field and inclination for late 2024, as modelled by the World Magnetic Model.
This map uses the Miller projection, which means bearings in the world are mostly what they are measured on the map, particularly around the equator. However, it compromises on representing true bearings around the poles, so that they can be seen closer than infinity and the map is not infinitely tall. It’s also the same projection as that ubiquitous declination chart, so you could, theoretically, make comparisons. If you were so… declined.
The dense mostly-vertical lines are ‘magnetic meridians’, the path you would take if you followed the tip of your compass while staying on the ground. Points along these lines are coloured according to inclination, which is the angle the actual field points into or out of the ground – so you can see the direction of the field at any point by its heading on the map, plus some amount up or down indicated by the coloured contours every 15°. By convention, the north pole that the field eminates from is coloured red, while the south pole where it converges again is coloured blue. The white ‘magnetic equator’ shows where the field is parallel to the ground.
For a more natural view, this is the globe seen from the north and south poles:
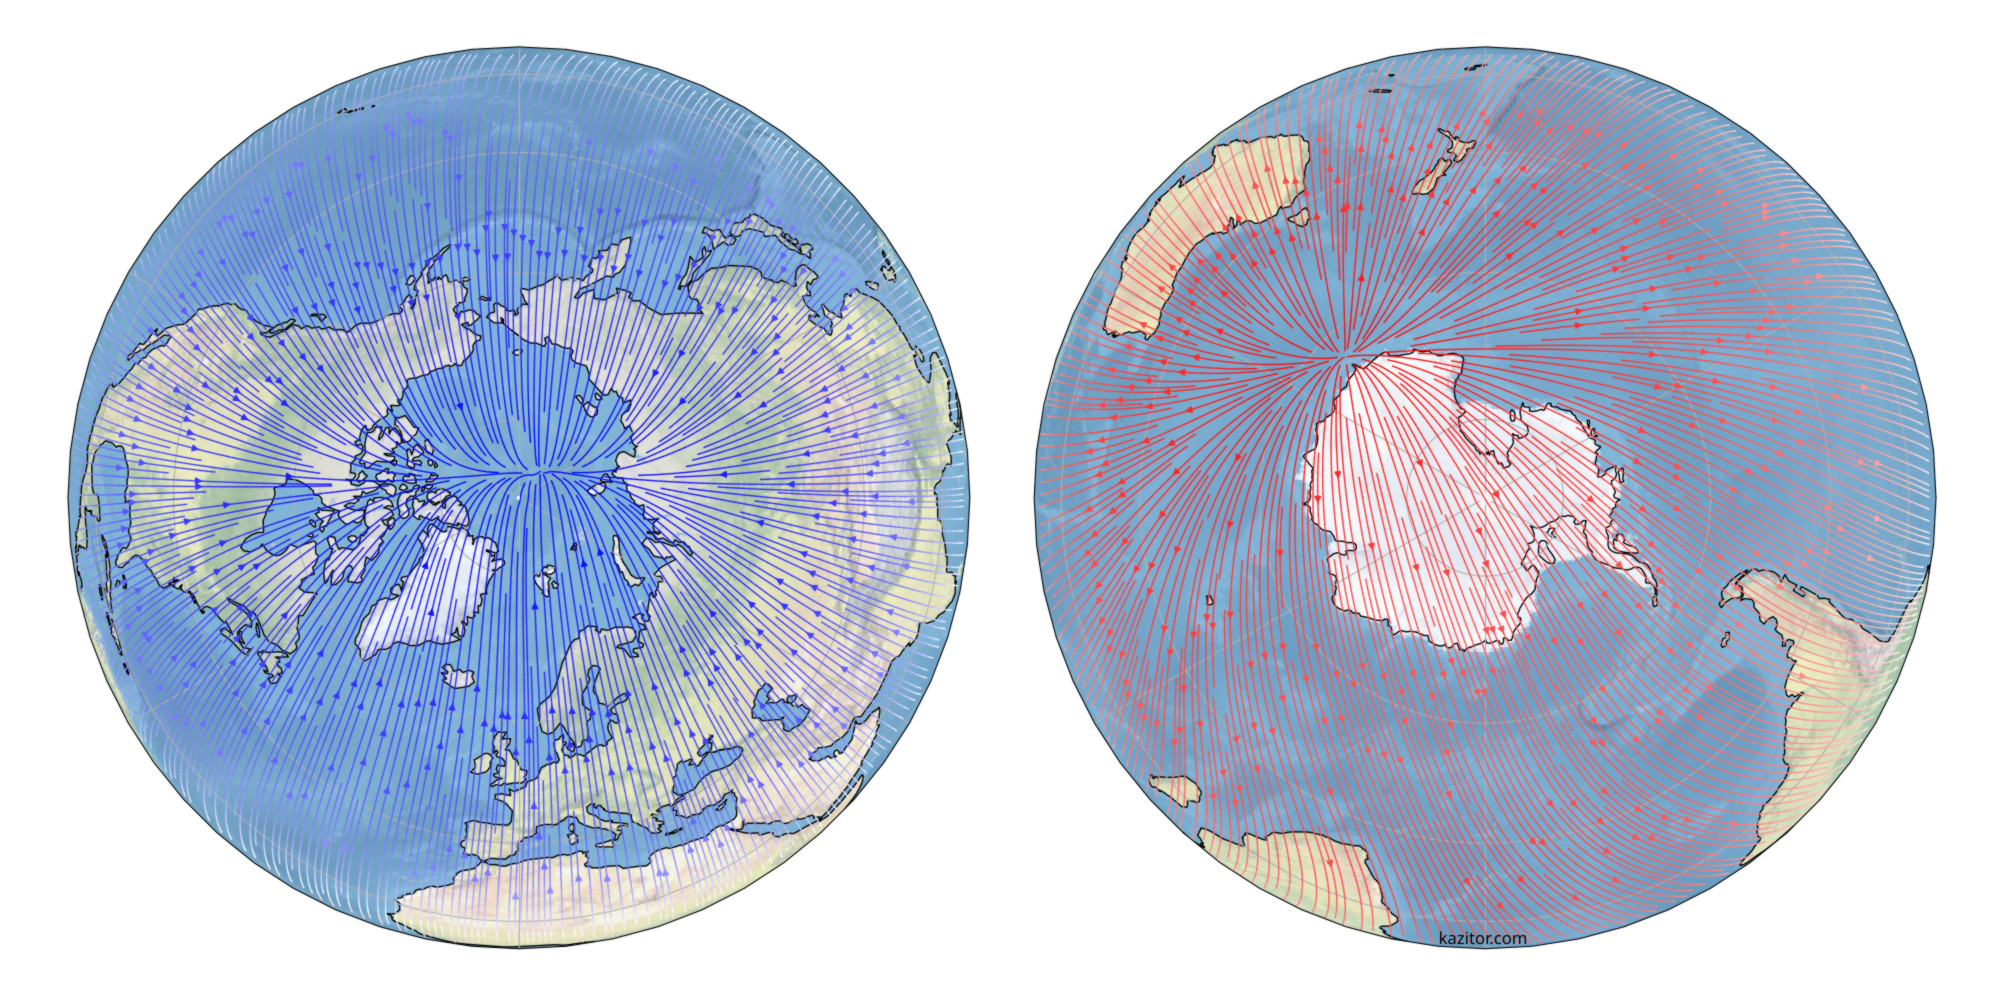
Funnily enough, a compass will actually work quite well across much of Antarctica, and won’t ever lead you in circles following the same bearing.
The next two are much the same, but centred directly on the magnetic poles. Specifically, the ‘dip poles’, the two points where the magnetic field points directly in or out of the ground and the horizontal component is zero.
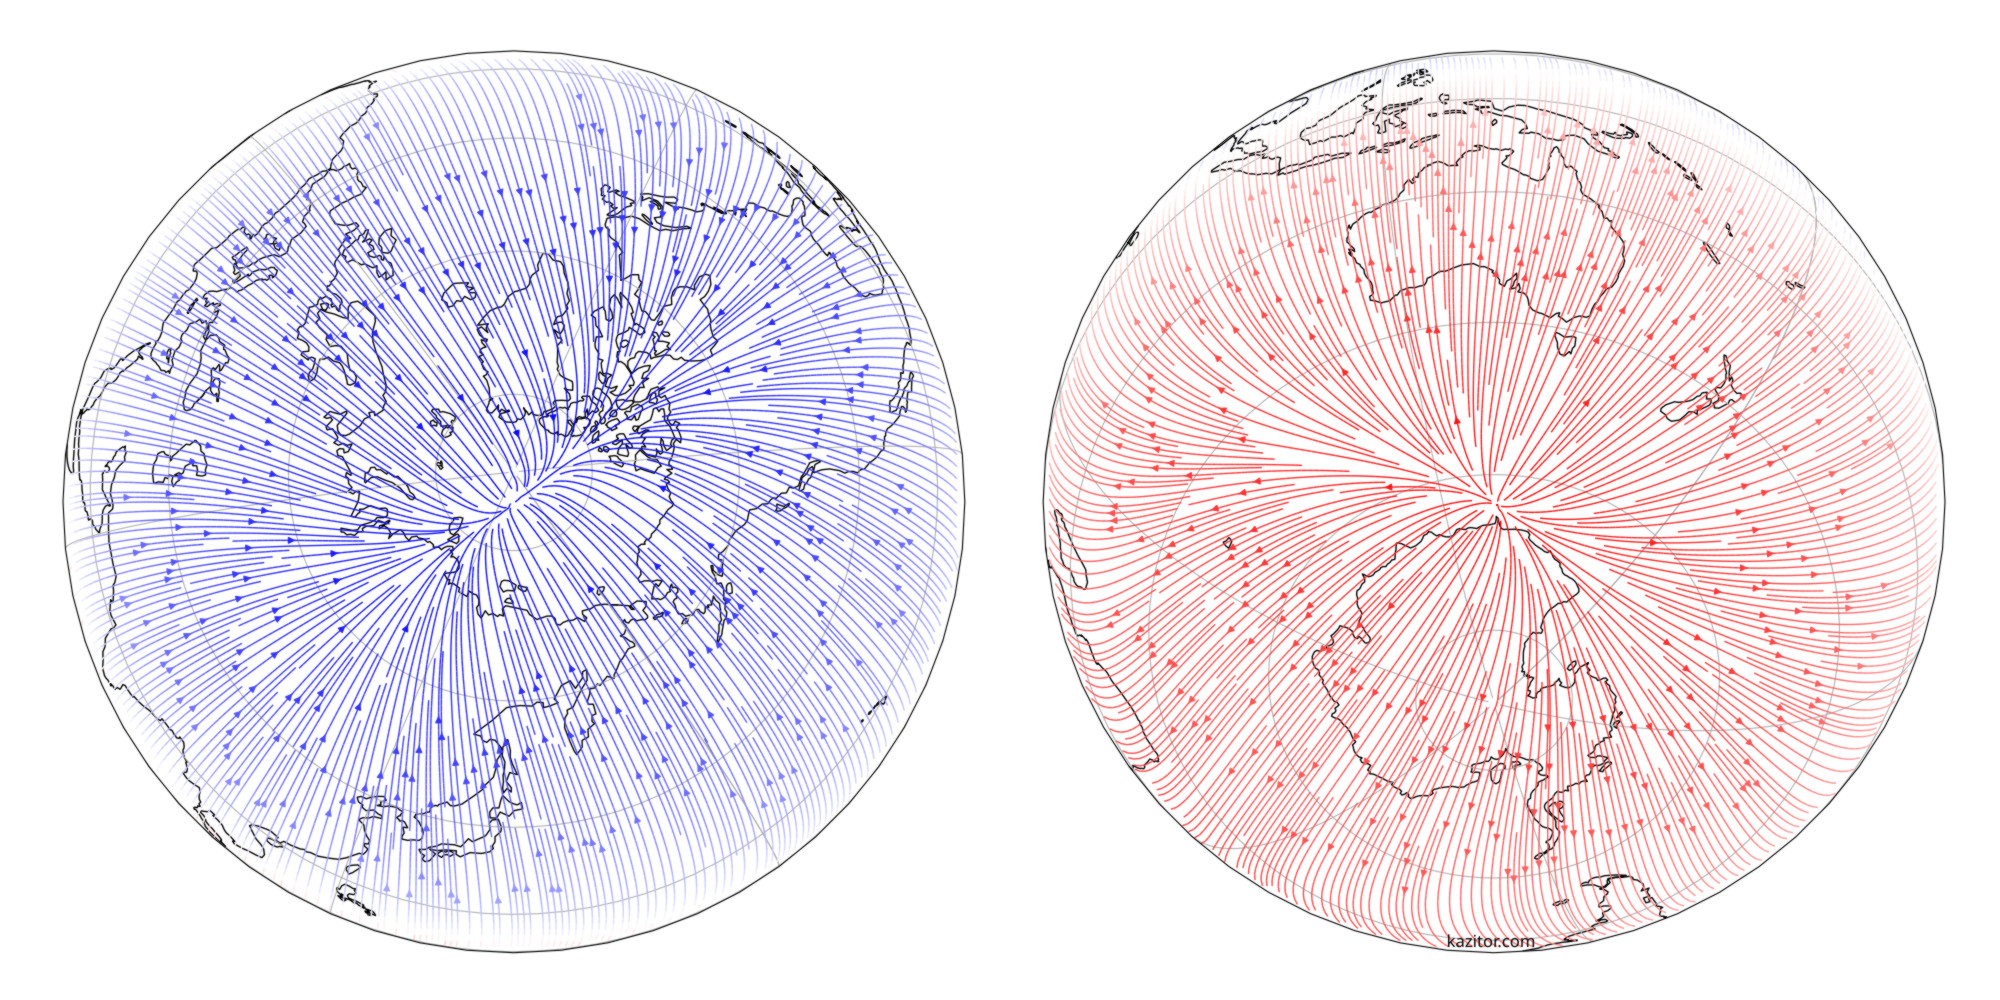
Many know that a compass doesn’t generally point north or south, but lesser known is that they don’t point to the magnetic north and south poles either. In fact, because those poles are not antipodal, in general a compass can’t have both ends simultaneously point to its respective pole. This is easily seen in these two maps – only lines pointed directly radially in or out from the centre are aligned with the poles. Instead, the horizontal field is seen to curve around towards the edges. It’s also quite clear the dip poles are not antipodal, with the southern dip pole being considerably further from its corresponding geographic pole.
One of the clearest things in these maps that isn’t evident from declination charts is the way the poles are somewhat smeared out, or pinched together when looking the other way. I haven’t investigated closely, but at a glance this ‘crease’ looks to be aligned with the direction the dip poles are migrating; for example the northern pole has been moving away from the Canadian Arctic Archipelago and towards Russia (and quite rapidly) over the last few decades.
The only headache in this process was some strange pinching of the field lines around the geographic poles. Eventually I worked out that that was due to the coordinate system being used by Cartopy – equirectangular coordinates significantly stretch the polar regions horizontally, which meant using unaltered east-west components of the magnetic field in this region caused the projected vectors to be compressed back in that direction, resulting in the field erroneously pointing north-south all around the poles. Cartopy doesn’t presently allow streamlines to be computed for vectors referenced directly to a geodetic reference system, but fortunately the horizontal scaling factor appropriate for equirectangular coordinates is easy to work out. It took a bit before I could tell whether there was actually a problem, though, especially because for a while I could not find a single map to compare to! So thank you to the CIRES/NCEI geomagnetism team for apparently having the only plots of the magnetic main field direction.
There’s more I can say and especially plot of the magnetic field, but I’m experimenting with this novel and reckless concept of actually publishing something before firmly wrapping up every loose ‘But also!’. Maybe a later follow-up.